Header — Holistic Wellbeing Living

Navneet Science Journal Std 10 All Practical Answers (2019 Board Pattern)

Std 10 Science Journal practical answer page showing completed observation table, labeled diagram, and final conclusion for Maharashtra Board syllabus.

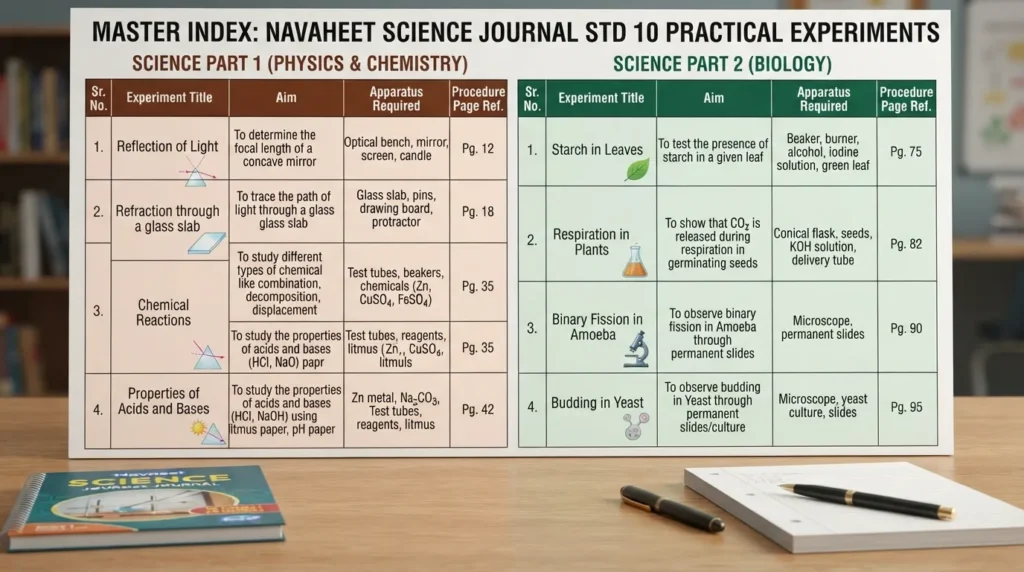
Finishing your Class 10 Science journal can feel like a rush against time, especially when board exams are around the corner. This guide gives you complete, accurate practical answers for the Navneet Science Journal (Std 10), updated to match the official 2019 Maharashtra SSC Board syllabus pattern. Whether you need step-by-step procedures, correct observation tables, or verified conclusion answers, everything for both Part 1 (Physics & Chemistry) and Part 2 (Biology & Environmental Science) is clearly solved below.

Note: You can also download or print this entire page as a PDF to keep standard answers handy while filling out your journal or revising for practical vivas.

Science Journal Part 1 — Physics & Chemistry Practical Answers

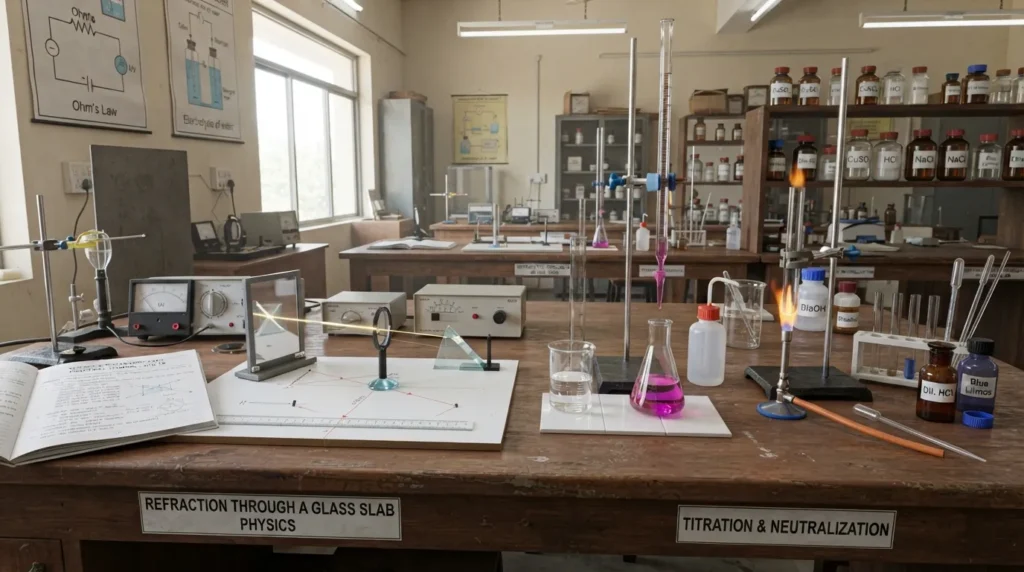
Science Experiments Practical Manual

Experiment 1 — Identification of Halide Ions (Cl⁻, Br⁻, I⁻)

Aim: To identify chloride (Cl), bromide (Br), and iodide (I) ions present in given salt solutions using silver nitrate solution.

Requirements: Test tubes, test tube stand, dropper, salt solutions (sodium chloride, potassium bromide, potassium iodide), dilute nitric acid (HNO3), and silver nitrate solution (AgNO3).

Procedure

  1. Take three clean test tubes and label them A, B, and C.
  2. Add about 2 mL of sodium chloride solution to test tube A, potassium bromide solution to test tube B, and potassium iodide solution to test tube C.
  3. Add 2–3 drops of dilute nitric acid to each test tube to clear any interfering ions.
  4. Add 2–3 drops of silver nitrate solution to each test tube and observe the color of the precipitate formed.
  5. Add dilute ammonium hydroxide (NH4OH) to test the solubility of each precipitate.
Labelled Diagram: Draw a clean schematic showing three test tubes held in a stand, each receiving drops of AgNO3 from a dropper, yielding white, pale yellow, and yellow precipitates respectively.

Observation Table

Test Tube Test Solution Reagent Added Observation Inference
A NaCl solution Dil. HNO3 + AgNO3 Curdy white precipitate; soluble in NH4OH Chloride ion (Cl) present
B KBr solution Dil. HNO3 + AgNO3 Pale yellow precipitate; sparingly soluble in NH4OH Bromide ion (Br) present
C KI solution Dil. HNO3 + AgNO3 Yellow precipitate; insoluble in NH4OH Iodide ion (I) present

Precautions

  • Always acidify the test solution with dilute nitric acid before adding silver nitrate.
  • Do not touch silver nitrate with bare hands, as it leaves black stains on skin.

Inference: Halide ions form characteristic colored precipitates with silver nitrate solution, allowing their identification based on color and solubility in ammonium hydroxide.

Viva-Voce Questions & Answers

Q1: Why do we add dilute nitric acid before adding silver nitrate?
Ans: Nitric acid decomposes any carbonate or sulphite impurities that might otherwise form false precipitates with silver nitrate.
Q2: What is the chemical formula of the white precipitate formed in test tube A?
Ans: Silver chloride (AgCl).
Q3: Which halide precipitate is completely insoluble in ammonium hydroxide?
Ans: Silver iodide (AgI).

Experiment 2 — Identification of the Type of Chemical Reaction

Aim: To carry out chemical reactions (burning magnesium ribbon, zinc with acid, heating lead nitrate) and classify their types.

Requirements: Magnesium ribbon, zinc granules, lead nitrate powder, dilute hydrochloric acid (HCl), pair of tongs, Bunsen burner, test tubes, delivery tube, single-bore rubber stopper.

Procedure

  1. Hold a piece of magnesium ribbon using tongs and burn it over a flame. Collect the ash.
  2. Take zinc granules in a test tube and add 3–4 mL of dilute hydrochloric acid. Bring a burning matchstick near the mouth of the tube.
  3. Take lead nitrate powder in a dry test tube and heat it strongly over a flame. Observe the gas evolved and color change.
Labelled Diagram: Draw three sub-diagrams: (a) Burning magnesium ribbon held by tongs, (b) Zinc reacting with acid in a test tube with gas evolving, (c) Test tube containing lead nitrate being heated over a burner.

Observation Table

Step Experiment Observation Type of Reaction
1 Burning Magnesium Ribbon Dazzling white flame; white ash (MgO) formed Combination Reaction / Exothermic
2 Zinc + Dilute HCl Gas bubbles evolve with effervescence; burns with a pop sound Displacement Reaction
3 Heating Lead Nitrate Reddish-brown gas (NO2) evolved; yellow residue remains Thermal Decomposition Reaction

Precautions

  • Wear safety glasses when burning magnesium because the light is intensely bright.
  • Keep the mouth of the test tube pointed away from yourself while heating lead nitrate.

Inference: Chemical processes are classified based on how reactants transform into products—either combining, breaking down, or displacing elements.

Viva-Voce Questions & Answers

Q1: What reddish-brown gas is released when lead nitrate breaks down?
Ans: Nitrogen dioxide (NO2).
Q2: Why does zinc displace hydrogen from dilute hydrochloric acid?
Ans: Zinc is higher than hydrogen in the reactivity series of metals.
Q3: What compound makes up the white powder left after burning magnesium?
Ans: Magnesium oxide (MgO).

Experiment 3 — Classification of Reactions

Aim: To observe specific chemical reactions and classify them as Combination, Decomposition, Displacement, or Double Displacement reactions.

Requirements: Quicklime (CaO), ferrous sulphate crystals (FeSO4·7H2O), copper sulphate solution (CuSO4), iron nails, sodium sulphate solution (Na2SO4), barium chloride solution (BaCl2), test tubes, beaker.

Procedure

  1. Combination: Add water slowly to a small amount of quicklime in a beaker. Touch the outside of the beaker.
  2. Decomposition: Heat dry green ferrous sulphate crystals in a hard glass test tube.
  3. Displacement: Dip clean iron nails into a blue copper sulphate solution and leave for 20 minutes.
  4. Double Displacement: Mix 2 mL sodium sulphate solution with 2 mL barium chloride solution in a test tube.
Labelled Diagram: Draw four sub-panels showing quicklime in a beaker with steam, heating green crystals in a tube, iron nail dipped in blue solution, and mixing two clear liquids to form a white precipitate.

Observation Table

Reactants Physical Change Observed Type of Reaction
Quicklime + Water Beaker becomes extremely hot; white slurry forms Combination Reaction (Exothermic)
Ferrous Sulphate (Heated) Green color turns white/brown; choking sulphur odor Decomposition Reaction
Iron Nail + CuSO4 Solution Blue color fades to pale green; brown coat on nail Displacement Reaction
Na2SO4 + BaCl2 Solutions Instant white precipitate (BaSO4) forms Double Displacement Reaction

Precautions

  • Do not touch quicklime directly with wet fingers.
  • Avoid directly inhaling gases coming off heated ferrous sulphate.

Inference: Reactions fall into four main categories based on whether bonds combine, break, swap single partners, or exchange ions simultaneously.

Viva-Voce Questions & Answers

Q1: What causes the blue color of copper sulphate to fade when an iron nail is immersed?
Ans: Iron displaces copper to form iron sulphate, which gives a light green solution.
Q2: What is the insoluble white substance formed during the reaction of sodium sulphate and barium chloride?
Ans: Barium sulphate (BaSO4).
Q3: Is the reaction of quicklime with water endothermic or exothermic?
Ans: It is highly exothermic because large amounts of heat energy are released.

Experiment 4 — Magnetic Field Produced by Electric Current in a Coil

Aim: To study the magnetic field pattern generated by an electric current passing through a circular loop/coil.

Requirements: Circular conducting coil, thick cardboard sheet, iron filings, DC battery source, plug key, rheostat, connecting wires, magnetic compass.

Procedure

  1. Pass the sides of a circular wire loop through two holes made in a flat piece of cardboard.
  2. Mount the cardboard horizontally and connect the ends of the coil to a DC battery, plug key, and rheostat in series.
  3. Sprinkle iron filings uniformly over the cardboard surface.
  4. Close the plug key and tap the cardboard gently several times.
  5. Observe the alignment of iron filings and trace field directions using a compass needle.
Labelled Diagram: Draw a circular wire loop penetrating a horizontal cardboard plane with concentric circular magnetic field lines drawn around both wire entry points, forming parallel straight lines at the center.

Observation Table

Position on Cardboard Pattern of Iron Filings Magnetic Field Line Characteristics
Near the wire edges Concentric circles Stronger field; smaller, tighter circular rings
Center of the circular coil Straight parallel lines Uniform field; direction perpendicular to coil plane

Precautions

  • Ensure all electrical connections are clean and tightly secured.
  • Tap the cardboard very gently so filings can re-orient freely without sliding off.

Inference: Current passing through a circular coil produces concentric magnetic field lines that become straight and uniform near the center of the loop.

Viva-Voce Questions & Answers

Q1: Which rule helps determine the direction of the magnetic field at the center of a circular loop?
Ans: The Right-Hand Thumb Rule.
Q2: How does increasing the number of turns in a coil affect magnetic field strength?
Ans: The magnetic field increases proportionally with the number of turns because fields from each turn add up.
Q3: What is the nature of the magnetic field right at the center of the coil?
Ans: It is practically uniform and represented by parallel straight lines.

Experiment 5 — Effect of Heat on Ice (Melting Point Graph)

Aim: To record the temperature of ice at regular time intervals during heating and plot a temperature-time graph to study latent heat.

Requirements: Crushed ice, beaker, laboratory thermometer (-10°C to 110°C), burner, tripod stand, wire gauze, stirrer, stopwatch.

Procedure

  1. Fill a glass beaker half-full with crushed ice.
  2. Suspend a thermometer into the ice using a stand, ensuring the bulb does not touch the beaker bottom.
  3. Note the initial temperature (0°C).
  4. Heat the beaker slowly on low flame while stirring constantly.
  5. Record the temperature every 30 seconds until water boils continuously for a few minutes.
  6. Plot a graph taking Time on the X-axis and Temperature on the Y-axis.
Labelled Diagram: Draw a beaker filled with ice sitting on wire gauze over a burner, with a thermometer suspended inside supported by a retort stand.

Observation Table

Time (Minutes) Temperature (°C) Physical State Present
0 0 Pure Ice
1 0 Ice + Water Mixture
2 0 Ice + Water Mixture
3 15 Water
5 50 Water
8 100 Water + Steam
9 100 Water + Steam

Precautions

  • Keep stirring continuously to maintain uniform temperature throughout the beaker.
  • Read the thermometer with your eye level parallel to the mercury meniscus.

Inference: During phase changes (melting and boiling), heat energy supplied goes into breaking molecular bonds (latent heat), keeping the temperature constant.

Viva-Voce Questions & Answers

Q1: What is latent heat of fusion?
Ans: It is the amount of heat energy required to change a unit mass of solid into liquid without any rise in temperature.
Q2: Why does the thermometer reading stay at 0°C while ice is melting?
Ans: Heat supplied is consumed in overcoming intermolecular forces rather than raising thermal kinetic energy.
Q3: What is the SI unit of specific latent heat?
Ans: Joules per kilogram (J/kg).

Experiment 6 — Natural Cooling of Hot Water (Temperature–Time Graph)

Aim: To study how hot water cools down naturally over time and plot a cooling curve (temperature vs time).

Requirements: Calorimeter or beaker, hot water source, laboratory thermometer, stopwatch, cardboard lid with hole, stand.

Procedure

  1. Pour hot water (around 80°C) into a beaker or calorimeter.
  2. Cover it with a cardboard lid and insert a thermometer through the center hole.
  3. Note the starting temperature once it settles around 70°C–75°C.
  4. Start the stopwatch and record the water temperature every 1 minute for 15–20 minutes.
  5. Plot a graph with Time on the X-axis and Temperature on the Y-axis.
Labelled Diagram: Draw a beaker containing hot water resting on an insulated pad, covered with a lid and holding an immersed thermometer.

Observation Table

Time (Minutes) Temperature (°C) Drop in Temp in Interval (°C)
0 75
2 68 7
4 62 6
6 57 5
8 53 4
10 50 3
12 48 2

Precautions

  • Keep the container away from direct air drafts or open windows.
  • Do not disturb or move the setup during reading intervals.

Inference: Hot water cools rapidly at higher temperatures and cools progressively slower as its temperature approaches surrounding room temperature.

Viva-Voce Questions & Answers

Q1: What shape does the cooling curve take on the graph?
Ans: It is a non-linear downward curve that flattens out gradually.
Q2: Why does cooling happen faster when the water is very hot?
Ans: The rate of heat loss is directly proportional to the temperature difference between the liquid and its surroundings.
Q3: What mechanisms cause the water in the beaker to cool down?
Ans: Conduction, convection, radiation, and evaporation.

Experiment 7 — Anomalous Behaviour of Water Using Hope's Apparatus

Aim: To demonstrate the unusual expansion/density property of water between 0°C and 4°C using Hope's apparatus.

Requirements: Hope's apparatus cylinder, freezing mixture (crushed ice + common salt), two sensitive laboratory thermometers (T1 bottom, T2 top), water.

Procedure

  1. Fill Hope's central cylinder with normal water at room temperature.
  2. Insert thermometer T1 at the bottom outer jacket outlet and thermometer T2 at the top outlet.
  3. Fill the central trough surrounding the cylinder with a freezing mixture of ice and salt.
  4. Record temperatures on both T1 and T2 every 2 minutes.
Labelled Diagram: Draw a tall central metal cylinder filled with water, surrounded at mid-height by a freezing trough, with upper thermometer T2 and lower thermometer T1 attached.

Observation Table

Time (Minutes) Lower Thermometer T1 (°C) Upper Thermometer T2 (°C) Remarks
0 12 12 Initial uniform water temp
4 4 10 Dense 4°C water sinks to bottom
8 4 4 Water throughout cools to 4°C
12 4 1 Water below 4°C expands, rises top
16 4 0 Top layer freezes first into ice

Precautions

  • Pack the freezing mixture tightly into the middle trough.
  • Ensure thermometer bulbs are completely submerged in water channels.

Inference: Water exhibits maximum density at 4°C. Below 4°C, water expands instead of contracting, causing colder water (0°C–3°C) to float upward.

Viva-Voce Questions & Answers

Q1: At what temperature does water reach its maximum density?
Ans: At 4°C.
Q2: Why does aquatic life survive in frozen ponds during harsh winters?
Ans: Ice forms on top at 0°C, while denser water remains liquid at 4°C underneath at the bottom.
Q3: Which thermometer shows a temperature drop down to 4°C first?
Ans: The lower thermometer (T1).

Experiment 8 — Verification of Laws of Refraction of Light

Aim: To trace the path of a ray of light through a rectangular glass slab and verify the laws of refraction.

Requirements: Glass slab, drawing board, white paper sheet, board pins, protractor, ruler, fine optical pins.

Procedure

  1. Fix white paper on a drawing board using pins. Place the glass slab in the center and trace its border ABCD.
  2. Draw a normal N1 and an incident ray making an angle i (e.g., 30°) on side AB.
  3. Fix two pins (P1, P2) vertically on the incident ray line.
  4. Look from the opposite side CD and fix two pins (P3, P4) aligned exactly with the images of P1 and P2.
  5. Remove the slab, join pin marks to trace refracted and emergent rays. Measure incident angle (i), refractive angle (r), and emergent angle (e).
Labelled Diagram: Draw a rectangular glass slab ABCD with incident ray, normal, angle of incidence i, angle of refraction r, emergent ray, emergent angle e, and lateral displacement indicated.

Observation Table

Trial Angle of Incidence (i) Angle of Refraction (r) Angle of Emergence (e) Difference (|i − e|)
1 30° 19° 30°
2 45° 28° 45°
3 60° 35° 60°

Precautions

  • Pins must be fixed strictly vertical and spaced at least 3–5 cm apart.
  • Use thin, sharp pencil lines for accurate angular measurement.

Inference: The angle of incidence equals the angle of emergence (i = e). Light bends toward the normal entering glass and away from normal re-entering air.

Viva-Voce Questions & Answers

Q1: What is Snell's Law of Refraction?
Ans: sin i / sin r = constant (refractive index of medium).
Q2: What is lateral displacement?
Ans: It is the perpendicular distance between the original produced incident ray path and the final emergent ray.
Q3: Does light speed up or slow down when entering glass from air?
Ans: It slows down because glass is an optically denser medium than air.

Experiment 9 — Refraction of Light Through a Glass Prism

Aim: To trace the path of light passing through a triangular glass prism and measure the angle of deviation (δ).

Requirements: Triangular glass prism, drawing board, white paper, board pins, optical pins, ruler, protractor.

Procedure

  1. Pin paper onto the drawing board and trace the triangular outline ABC of the glass prism.
  2. Draw a line for an incident ray on face AB at an angle (e.g., 40°) to the normal.
  3. Fix two pins (P1, P2) on the incident ray line.
  4. View through face AC and place pins P3 and P4 so they line up with images of P1 and P2.
  5. Remove prism, connect points to mark emergent ray. Extend incident ray forward and emergent ray backward to meet at point G. Measure angle of deviation (δ).
Labelled Diagram: Draw triangular prism ABC, showing incident ray, refracted ray inside, emergent ray bending toward base, normal lines, angle of incidence i, angle of prism A, and angle of deviation δ.

Observation Table

Trial Angle of Prism (A) Angle of Incidence (i) Angle of Emergence (e) Angle of Deviation (δ)
1 60° 35° 58° 33°
2 60° 45° 45° 30°
3 60° 55° 38° 33°

Precautions

  • Keep the angle of incidence between 35° and 60°.
  • Ensure optical pins stand perfectly straight on the board.

Inference: A prism bends light toward its thick base twice, causing an angular shift between the incoming incident ray and outgoing emergent ray known as deviation.

Viva-Voce Questions & Answers

Q1: What is the angle of deviation?
Ans: The angle formed between the extended direction of the incident ray and the backward-extended emergent ray.
Q2: Which basic relation links A, δ, i, and e in a prism?
Ans: A + δ = i + e.
Q3: Why does a prism disperse white light into component colors?
Ans: Different wavelengths/colors of light travel at different speeds in glass, bending by different amounts.

Experiment 10 — Determination of Focal Length of a Convex Lens

Aim: To determine the focal length of a convex lens by obtaining a sharp image of a distant object on a screen.

Requirements: Thin convex lens, lens holder, small white screen with holder, meter scale.

Procedure

  1. Mount the convex lens on a stand and place it near an open window facing a distant object (tree or building).
  2. Place the white screen behind the lens.
  3. Move the screen forward or backward until a clear, sharp, inverted image of the distant object appears on it.
  4. Measure the distance between the optical center of the convex lens and the screen using a meter scale.
  5. Repeat the reading 3 times targeting different distant objects.
Labelled Diagram: Draw parallel rays coming from a distant object passing through a convex lens and converging to form an inverted sharp image at the principal focus on a vertical screen.

Observation Table

Trial Distant Target Object Measured Distance Lens-to-Screen (f in cm) Mean Focal Length (f in cm)
1 Distant Tree 15.1
2 Far Electric Pole 15.0 15.0 cm
3 Distant Building 14.9

Precautions

  • The distant object must be well-lit and far away so incoming light rays are nearly parallel.
  • Measure distance horizontally keeping the scale parallel to the principal axis.

Inference: The distance at which a sharp image of a very distant object forms on a screen equals the focal length (f) of the convex lens.

Viva-Voce Questions & Answers

Q1: What type of image is formed by a convex lens for a distant object?
Ans: Real, inverted, and highly diminished image at the focus.
Q2: Can you find the focal length of a concave lens using this method? Why?
Ans: No, because a concave lens forms a virtual image that cannot be caught on a screen.
Q3: What is the power of a convex lens of focal length 20 cm?
Ans: P = 100 / 20 = +5 D (Dioptres).

Experiment 11 — Arranging Metals in Decreasing Order of Reactivity

Aim: To observe the reactivity of metals (Zn, Fe, Cu, Al) with aqueous salt solutions (ZnSO4, FeSO4, CuSO4, Al2(SO4)3) and arrange them by decreasing reactivity.

Requirements: Strips of zinc, iron nails, copper turnings, aluminum foil; aqueous solutions of ZnSO4, FeSO4, CuSO4, Al2(SO4)3; test tubes, test tube stand, sandpaper.

Procedure

  1. Clean all metal strips thoroughly using sandpaper.
  2. Set up test tubes filled with individual salt solutions.
  3. Dip each metal strip into separate test tubes containing each salt solution.
  4. Leave the test tubes undisturbed for 20 minutes and observe if displacement occurs (coating on metal or color change).
Labelled Diagram: Draw an array of test tubes containing blue, green, and clear salt solutions with various metal strips immersed in them.

Observation Table

Metal Added ZnSO4 Solution FeSO4 Solution CuSO4 Solution Al2(SO4)3 Solution
Aluminum (Al) Reaction (Displaces Zn) Reaction (Displaces Fe) Reaction (Displaces Cu) No Reaction
Zinc (Zn) No Reaction Reaction (Displaces Fe) Reaction (Displaces Cu) No Reaction
Iron (Fe) No Reaction No Reaction Reaction (Displaces Cu) No Reaction
Copper (Cu) No Reaction No Reaction No Reaction No Reaction

Precautions

  • Scrape off surface oxide layers on metal strips using sandpaper before dipping.
  • Do not disturb test tubes during the observation period.

Inference: A more reactive metal displaces a less reactive metal from its salt solution. The decreasing order of reactivity observed is:
Al > Zn > Fe > Cu

Viva-Voce Questions & Answers

Q1: Which metal among the tested ones is the most reactive?
Ans: Aluminum (Al).
Q2: What happens when a copper strip is placed in zinc sulphate solution?
Ans: No reaction occurs because copper is less reactive than zinc.
Q3: Why must metal strips be cleaned with sandpaper before the experiment?
Ans: To remove oxide coating layers that block direct contact between metal and solution.

Experiment 12 — Oxidation and Addition Reactions of Carbon Compounds

Aim: To carry out oxidation of ethanol using alkaline potassium permanganate and addition reaction of unsaturated hydrocarbons using bromine water/iodine.

Requirements: Ethanol (C2H5OH), alkaline KMnO4 solution, vegetable oil, butter/ghee, bromine water or iodine solution, test tubes, water bath, dropper, burner.

Procedure

  1. Oxidation: Take 2 mL of ethanol in a test tube. Heat it gently in a water bath. Add alkaline KMnO4 drop by drop while shaking. Note color disappearance.
  2. Addition: Take 2 mL of vegetable oil in test tube A and melted butter/ghee in test tube B. Add a few drops of bromine water or iodine solution to both and shake well.
Labelled Diagram: Draw two test tubes: one receiving drops of purple KMnO4 while sitting in a water bath, and two test tubes comparing bromine water decolorization in oil vs butter.

Observation Table

Test / Reactants Reagent Added Observation Type of Reaction
Ethanol + Heat Alkaline KMnO4 (dropwise) Pink color disappears initially, stays permanently when added in excess Oxidation Reaction
Vegetable Oil Bromine Water / Iodine Brown/Yellow color decolorizes Addition Reaction (Unsaturated)
Butter / Ghee Bromine Water / Iodine Brown/Yellow color remains unchanged No Addition Reaction (Saturated)

Precautions

  • Heat ethanol strictly using a warm water bath because ethanol is highly flammable.
  • Handle bromine water with care under guidance.

Inference: Ethanol undergoes oxidation to ethanoic acid using alkaline KMnO4. Unsaturated carbon compounds (oils) readily undergo addition reactions, whereas saturated compounds (ghee) do not.

Viva-Voce Questions & Answers

Q1: What role does alkaline KMnO4 play in the ethanol reaction?
Ans: It acts as an oxidizing agent, supplying oxygen to convert ethanol into ethanoic acid.
Q2: Why does vegetable oil decolorize bromine water while butter does not?
Ans: Vegetable oil contains unsaturated double bonds that add bromine across them, whereas butter contains saturated single bonds.
Q3: Write the chemical equation for the oxidation of ethanol.
Ans: CH3CH2OH  →[Alkaline KMnO4 + Heat]  CH3COOH

Science Journal Part 2 — Biology Practical Answers

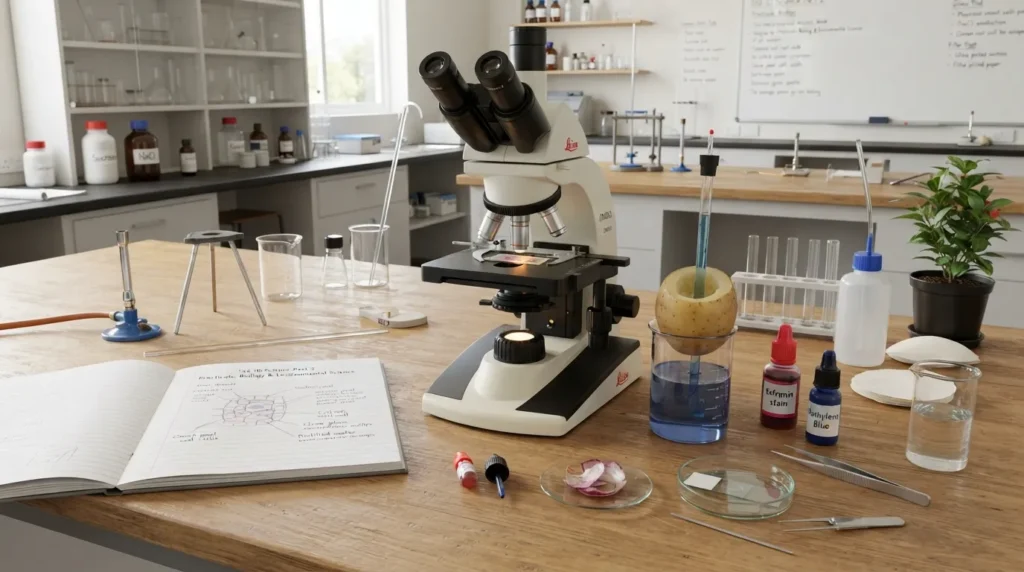
Science Experiments Practical Manual

Experiment 1 — Identification of Halide Ions (Cl⁻, Br⁻, I⁻)

Aim: To identify chloride (Cl), bromide (Br), and iodide (I) ions present in given salt solutions using silver nitrate solution.

Requirements: Test tubes, test tube stand, dropper, salt solutions (sodium chloride, potassium bromide, potassium iodide), dilute nitric acid (HNO3), and silver nitrate solution (AgNO3).

Procedure

  1. Take three clean test tubes and label them A, B, and C.
  2. Add about 2 mL of sodium chloride solution to test tube A, potassium bromide solution to test tube B, and potassium iodide solution to test tube C.
  3. Add 2–3 drops of dilute nitric acid to each test tube to clear any interfering ions.
  4. Add 2–3 drops of silver nitrate solution to each test tube and observe the color of the precipitate formed.
  5. Add dilute ammonium hydroxide (NH4OH) to test the solubility of each precipitate.
Labelled Diagram: Draw a clean schematic showing three test tubes held in a stand, each receiving drops of AgNO3 from a dropper, yielding white, pale yellow, and yellow precipitates respectively.

Observation Table

Test Tube Test Solution Reagent Added Observation Inference
A NaCl solution Dil. HNO3 + AgNO3 Curdy white precipitate; soluble in NH4OH Chloride ion (Cl) present
B KBr solution Dil. HNO3 + AgNO3 Pale yellow precipitate; sparingly soluble in NH4OH Bromide ion (Br) present
C KI solution Dil. HNO3 + AgNO3 Yellow precipitate; insoluble in NH4OH Iodide ion (I) present

Precautions

  • Always acidify the test solution with dilute nitric acid before adding silver nitrate.
  • Do not touch silver nitrate with bare hands, as it leaves black stains on skin.

Inference: Halide ions form characteristic colored precipitates with silver nitrate solution, allowing their identification based on color and solubility in ammonium hydroxide.

Viva-Voce Questions & Answers

Q1: Why do we add dilute nitric acid before adding silver nitrate?
Ans: Nitric acid decomposes any carbonate or sulphite impurities that might otherwise form false precipitates with silver nitrate.
Q2: What is the chemical formula of the white precipitate formed in test tube A?
Ans: Silver chloride (AgCl).
Q3: Which halide precipitate is completely insoluble in ammonium hydroxide?
Ans: Silver iodide (AgI).

Experiment 2 — Identification of the Type of Chemical Reaction

Aim: To carry out chemical reactions (burning magnesium ribbon, zinc with acid, heating lead nitrate) and classify their types.

Requirements: Magnesium ribbon, zinc granules, lead nitrate powder, dilute hydrochloric acid (HCl), pair of tongs, Bunsen burner, test tubes, delivery tube, single-bore rubber stopper.

Procedure

  1. Hold a piece of magnesium ribbon using tongs and burn it over a flame. Collect the ash.
  2. Take zinc granules in a test tube and add 3–4 mL of dilute hydrochloric acid. Bring a burning matchstick near the mouth of the tube.
  3. Take lead nitrate powder in a dry test tube and heat it strongly over a flame. Observe the gas evolved and color change.
Labelled Diagram: Draw three sub-diagrams: (a) Burning magnesium ribbon held by tongs, (b) Zinc reacting with acid in a test tube with gas evolving, (c) Test tube containing lead nitrate being heated over a burner.

Observation Table

Step Experiment Observation Type of Reaction
1 Burning Magnesium Ribbon Dazzling white flame; white ash (MgO) formed Combination Reaction / Exothermic
2 Zinc + Dilute HCl Gas bubbles evolve with effervescence; burns with a pop sound Displacement Reaction
3 Heating Lead Nitrate Reddish-brown gas (NO2) evolved; yellow residue remains Thermal Decomposition Reaction

Precautions

  • Wear safety glasses when burning magnesium because the light is intensely bright.
  • Keep the mouth of the test tube pointed away from yourself while heating lead nitrate.

Inference: Chemical processes are classified based on how reactants transform into products—either combining, breaking down, or displacing elements.

Viva-Voce Questions & Answers

Q1: What reddish-brown gas is released when lead nitrate breaks down?
Ans: Nitrogen dioxide (NO2).
Q2: Why does zinc displace hydrogen from dilute hydrochloric acid?
Ans: Zinc is higher than hydrogen in the reactivity series of metals.
Q3: What compound makes up the white powder left after burning magnesium?
Ans: Magnesium oxide (MgO).

Experiment 3 — Classification of Reactions

Aim: To observe specific chemical reactions and classify them as Combination, Decomposition, Displacement, or Double Displacement reactions.

Requirements: Quicklime (CaO), ferrous sulphate crystals (FeSO4·7H2O), copper sulphate solution (CuSO4), iron nails, sodium sulphate solution (Na2SO4), barium chloride solution (BaCl2), test tubes, beaker.

Procedure

  1. Combination: Add water slowly to a small amount of quicklime in a beaker. Touch the outside of the beaker.
  2. Decomposition: Heat dry green ferrous sulphate crystals in a hard glass test tube.
  3. Displacement: Dip clean iron nails into a blue copper sulphate solution and leave for 20 minutes.
  4. Double Displacement: Mix 2 mL sodium sulphate solution with 2 mL barium chloride solution in a test tube.
Labelled Diagram: Draw four sub-panels showing quicklime in a beaker with steam, heating green crystals in a tube, iron nail dipped in blue solution, and mixing two clear liquids to form a white precipitate.

Observation Table

Reactants Physical Change Observed Type of Reaction
Quicklime + Water Beaker becomes extremely hot; white slurry forms Combination Reaction (Exothermic)
Ferrous Sulphate (Heated) Green color turns white/brown; choking sulphur odor Decomposition Reaction
Iron Nail + CuSO4 Solution Blue color fades to pale green; brown coat on nail Displacement Reaction
Na2SO4 + BaCl2 Solutions Instant white precipitate (BaSO4) forms Double Displacement Reaction

Precautions

  • Do not touch quicklime directly with wet fingers.
  • Avoid directly inhaling gases coming off heated ferrous sulphate.

Inference: Reactions fall into four main categories based on whether bonds combine, break, swap single partners, or exchange ions simultaneously.

Viva-Voce Questions & Answers

Q1: What causes the blue color of copper sulphate to fade when an iron nail is immersed?
Ans: Iron displaces copper to form iron sulphate, which gives a light green solution.
Q2: What is the insoluble white substance formed during the reaction of sodium sulphate and barium chloride?
Ans: Barium sulphate (BaSO4).
Q3: Is the reaction of quicklime with water endothermic or exothermic?
Ans: It is highly exothermic because large amounts of heat energy are released.

Experiment 4 — Magnetic Field Produced by Electric Current in a Coil

Aim: To study the magnetic field pattern generated by an electric current passing through a circular loop/coil.

Requirements: Circular conducting coil, thick cardboard sheet, iron filings, DC battery source, plug key, rheostat, connecting wires, magnetic compass.

Procedure

  1. Pass the sides of a circular wire loop through two holes made in a flat piece of cardboard.
  2. Mount the cardboard horizontally and connect the ends of the coil to a DC battery, plug key, and rheostat in series.
  3. Sprinkle iron filings uniformly over the cardboard surface.
  4. Close the plug key and tap the cardboard gently several times.
  5. Observe the alignment of iron filings and trace field directions using a compass needle.
Labelled Diagram: Draw a circular wire loop penetrating a horizontal cardboard plane with concentric circular magnetic field lines drawn around both wire entry points, forming parallel straight lines at the center.

Observation Table

Position on Cardboard Pattern of Iron Filings Magnetic Field Line Characteristics
Near the wire edges Concentric circles Stronger field; smaller, tighter circular rings
Center of the circular coil Straight parallel lines Uniform field; direction perpendicular to coil plane

Precautions

  • Ensure all electrical connections are clean and tightly secured.
  • Tap the cardboard very gently so filings can re-orient freely without sliding off.

Inference: Current passing through a circular coil produces concentric magnetic field lines that become straight and uniform near the center of the loop.

Viva-Voce Questions & Answers

Q1: Which rule helps determine the direction of the magnetic field at the center of a circular loop?
Ans: The Right-Hand Thumb Rule.
Q2: How does increasing the number of turns in a coil affect magnetic field strength?
Ans: The magnetic field increases proportionally with the number of turns because fields from each turn add up.
Q3: What is the nature of the magnetic field right at the center of the coil?
Ans: It is practically uniform and represented by parallel straight lines.

Experiment 5 — Effect of Heat on Ice (Melting Point Graph)

Aim: To record the temperature of ice at regular time intervals during heating and plot a temperature-time graph to study latent heat.

Requirements: Crushed ice, beaker, laboratory thermometer (-10°C to 110°C), burner, tripod stand, wire gauze, stirrer, stopwatch.

Procedure

  1. Fill a glass beaker half-full with crushed ice.
  2. Suspend a thermometer into the ice using a stand, ensuring the bulb does not touch the beaker bottom.
  3. Note the initial temperature (0°C).
  4. Heat the beaker slowly on low flame while stirring constantly.
  5. Record the temperature every 30 seconds until water boils continuously for a few minutes.
  6. Plot a graph taking Time on the X-axis and Temperature on the Y-axis.
Labelled Diagram: Draw a beaker filled with ice sitting on wire gauze over a burner, with a thermometer suspended inside supported by a retort stand.

Observation Table

Time (Minutes) Temperature (°C) Physical State Present
0 0 Pure Ice
1 0 Ice + Water Mixture
2 0 Ice + Water Mixture
3 15 Water
5 50 Water
8 100 Water + Steam
9 100 Water + Steam

Precautions

  • Keep stirring continuously to maintain uniform temperature throughout the beaker.
  • Read the thermometer with your eye level parallel to the mercury meniscus.

Inference: During phase changes (melting and boiling), heat energy supplied goes into breaking molecular bonds (latent heat), keeping the temperature constant.

Viva-Voce Questions & Answers

Q1: What is latent heat of fusion?
Ans: It is the amount of heat energy required to change a unit mass of solid into liquid without any rise in temperature.
Q2: Why does the thermometer reading stay at 0°C while ice is melting?
Ans: Heat supplied is consumed in overcoming intermolecular forces rather than raising thermal kinetic energy.
Q3: What is the SI unit of specific latent heat?
Ans: Joules per kilogram (J/kg).

Experiment 6 — Natural Cooling of Hot Water (Temperature–Time Graph)

Aim: To study how hot water cools down naturally over time and plot a cooling curve (temperature vs time).

Requirements: Calorimeter or beaker, hot water source, laboratory thermometer, stopwatch, cardboard lid with hole, stand.

Procedure

  1. Pour hot water (around 80°C) into a beaker or calorimeter.
  2. Cover it with a cardboard lid and insert a thermometer through the center hole.
  3. Note the starting temperature once it settles around 70°C–75°C.
  4. Start the stopwatch and record the water temperature every 1 minute for 15–20 minutes.
  5. Plot a graph with Time on the X-axis and Temperature on the Y-axis.
Labelled Diagram: Draw a beaker containing hot water resting on an insulated pad, covered with a lid and holding an immersed thermometer.

Observation Table

Time (Minutes) Temperature (°C) Drop in Temp in Interval (°C)
0 75
2 68 7
4 62 6
6 57 5
8 53 4
10 50 3
12 48 2

Precautions

  • Keep the container away from direct air drafts or open windows.
  • Do not disturb or move the setup during reading intervals.

Inference: Hot water cools rapidly at higher temperatures and cools progressively slower as its temperature approaches surrounding room temperature.

Viva-Voce Questions & Answers

Q1: What shape does the cooling curve take on the graph?
Ans: It is a non-linear downward curve that flattens out gradually.
Q2: Why does cooling happen faster when the water is very hot?
Ans: The rate of heat loss is directly proportional to the temperature difference between the liquid and its surroundings.
Q3: What mechanisms cause the water in the beaker to cool down?
Ans: Conduction, convection, radiation, and evaporation.

Experiment 7 — Anomalous Behaviour of Water Using Hope's Apparatus

Aim: To demonstrate the unusual expansion/density property of water between 0°C and 4°C using Hope's apparatus.

Requirements: Hope's apparatus cylinder, freezing mixture (crushed ice + common salt), two sensitive laboratory thermometers (T1 bottom, T2 top), water.

Procedure

  1. Fill Hope's central cylinder with normal water at room temperature.
  2. Insert thermometer T1 at the bottom outer jacket outlet and thermometer T2 at the top outlet.
  3. Fill the central trough surrounding the cylinder with a freezing mixture of ice and salt.
  4. Record temperatures on both T1 and T2 every 2 minutes.
Labelled Diagram: Draw a tall central metal cylinder filled with water, surrounded at mid-height by a freezing trough, with upper thermometer T2 and lower thermometer T1 attached.

Observation Table

Time (Minutes) Lower Thermometer T1 (°C) Upper Thermometer T2 (°C) Remarks
0 12 12 Initial uniform water temp
4 4 10 Dense 4°C water sinks to bottom
8 4 4 Water throughout cools to 4°C
12 4 1 Water below 4°C expands, rises top
16 4 0 Top layer freezes first into ice

Precautions

  • Pack the freezing mixture tightly into the middle trough.
  • Ensure thermometer bulbs are completely submerged in water channels.

Inference: Water exhibits maximum density at 4°C. Below 4°C, water expands instead of contracting, causing colder water (0°C–3°C) to float upward.

Viva-Voce Questions & Answers

Q1: At what temperature does water reach its maximum density?
Ans: At 4°C.
Q2: Why does aquatic life survive in frozen ponds during harsh winters?
Ans: Ice forms on top at 0°C, while denser water remains liquid at 4°C underneath at the bottom.
Q3: Which thermometer shows a temperature drop down to 4°C first?
Ans: The lower thermometer (T1).

Experiment 8 — Verification of Laws of Refraction of Light

Aim: To trace the path of a ray of light through a rectangular glass slab and verify the laws of refraction.

Requirements: Glass slab, drawing board, white paper sheet, board pins, protractor, ruler, fine optical pins.

Procedure

  1. Fix white paper on a drawing board using pins. Place the glass slab in the center and trace its border ABCD.
  2. Draw a normal N1 and an incident ray making an angle i (e.g., 30°) on side AB.
  3. Fix two pins (P1, P2) vertically on the incident ray line.
  4. Look from the opposite side CD and fix two pins (P3, P4) aligned exactly with the images of P1 and P2.
  5. Remove the slab, join pin marks to trace refracted and emergent rays. Measure incident angle (i), refractive angle (r), and emergent angle (e).
Labelled Diagram: Draw a rectangular glass slab ABCD with incident ray, normal, angle of incidence i, angle of refraction r, emergent ray, emergent angle e, and lateral displacement indicated.

Observation Table

Trial Angle of Incidence (i) Angle of Refraction (r) Angle of Emergence (e) Difference (|i − e|)
1 30° 19° 30°
2 45° 28° 45°
3 60° 35° 60°

Precautions

  • Pins must be fixed strictly vertical and spaced at least 3–5 cm apart.
  • Use thin, sharp pencil lines for accurate angular measurement.

Inference: The angle of incidence equals the angle of emergence (i = e). Light bends toward the normal entering glass and away from normal re-entering air.

Viva-Voce Questions & Answers

Q1: What is Snell's Law of Refraction?
Ans: sin i / sin r = constant (refractive index of medium).
Q2: What is lateral displacement?
Ans: It is the perpendicular distance between the original produced incident ray path and the final emergent ray.
Q3: Does light speed up or slow down when entering glass from air?
Ans: It slows down because glass is an optically denser medium than air.

Experiment 9 — Refraction of Light Through a Glass Prism

Aim: To trace the path of light passing through a triangular glass prism and measure the angle of deviation (δ).

Requirements: Triangular glass prism, drawing board, white paper, board pins, optical pins, ruler, protractor.

Procedure

  1. Pin paper onto the drawing board and trace the triangular outline ABC of the glass prism.
  2. Draw a line for an incident ray on face AB at an angle (e.g., 40°) to the normal.
  3. Fix two pins (P1, P2) on the incident ray line.
  4. View through face AC and place pins P3 and P4 so they line up with images of P1 and P2.
  5. Remove prism, connect points to mark emergent ray. Extend incident ray forward and emergent ray backward to meet at point G. Measure angle of deviation (δ).
Labelled Diagram: Draw triangular prism ABC, showing incident ray, refracted ray inside, emergent ray bending toward base, normal lines, angle of incidence i, angle of prism A, and angle of deviation δ.

Observation Table

Trial Angle of Prism (A) Angle of Incidence (i) Angle of Emergence (e) Angle of Deviation (δ)
1 60° 35° 58° 33°
2 60° 45° 45° 30°
3 60° 55° 38° 33°

Precautions

  • Keep the angle of incidence between 35° and 60°.
  • Ensure optical pins stand perfectly straight on the board.

Inference: A prism bends light toward its thick base twice, causing an angular shift between the incoming incident ray and outgoing emergent ray known as deviation.

Viva-Voce Questions & Answers

Q1: What is the angle of deviation?
Ans: The angle formed between the extended direction of the incident ray and the backward-extended emergent ray.
Q2: Which basic relation links A, δ, i, and e in a prism?
Ans: A + δ = i + e.
Q3: Why does a prism disperse white light into component colors?
Ans: Different wavelengths/colors of light travel at different speeds in glass, bending by different amounts.

Experiment 10 — Determination of Focal Length of a Convex Lens

Aim: To determine the focal length of a convex lens by obtaining a sharp image of a distant object on a screen.

Requirements: Thin convex lens, lens holder, small white screen with holder, meter scale.

Procedure

  1. Mount the convex lens on a stand and place it near an open window facing a distant object (tree or building).
  2. Place the white screen behind the lens.
  3. Move the screen forward or backward until a clear, sharp, inverted image of the distant object appears on it.
  4. Measure the distance between the optical center of the convex lens and the screen using a meter scale.
  5. Repeat the reading 3 times targeting different distant objects.
Labelled Diagram: Draw parallel rays coming from a distant object passing through a convex lens and converging to form an inverted sharp image at the principal focus on a vertical screen.

Observation Table

Trial Distant Target Object Measured Distance Lens-to-Screen (f in cm) Mean Focal Length (f in cm)
1 Distant Tree 15.1
2 Far Electric Pole 15.0 15.0 cm
3 Distant Building 14.9

Precautions

  • The distant object must be well-lit and far away so incoming light rays are nearly parallel.
  • Measure distance horizontally keeping the scale parallel to the principal axis.

Inference: The distance at which a sharp image of a very distant object forms on a screen equals the focal length (f) of the convex lens.

Viva-Voce Questions & Answers

Q1: What type of image is formed by a convex lens for a distant object?
Ans: Real, inverted, and highly diminished image at the focus.
Q2: Can you find the focal length of a concave lens using this method? Why?
Ans: No, because a concave lens forms a virtual image that cannot be caught on a screen.
Q3: What is the power of a convex lens of focal length 20 cm?
Ans: P = 100 / 20 = +5 D (Dioptres).

Experiment 11 — Arranging Metals in Decreasing Order of Reactivity

Aim: To observe the reactivity of metals (Zn, Fe, Cu, Al) with aqueous salt solutions (ZnSO4, FeSO4, CuSO4, Al2(SO4)3) and arrange them by decreasing reactivity.

Requirements: Strips of zinc, iron nails, copper turnings, aluminum foil; aqueous solutions of ZnSO4, FeSO4, CuSO4, Al2(SO4)3; test tubes, test tube stand, sandpaper.

Procedure

  1. Clean all metal strips thoroughly using sandpaper.
  2. Set up test tubes filled with individual salt solutions.
  3. Dip each metal strip into separate test tubes containing each salt solution.
  4. Leave the test tubes undisturbed for 20 minutes and observe if displacement occurs (coating on metal or color change).
Labelled Diagram: Draw an array of test tubes containing blue, green, and clear salt solutions with various metal strips immersed in them.

Observation Table

Metal Added ZnSO4 Solution FeSO4 Solution CuSO4 Solution Al2(SO4)3 Solution
Aluminum (Al) Reaction (Displaces Zn) Reaction (Displaces Fe) Reaction (Displaces Cu) No Reaction
Zinc (Zn) No Reaction Reaction (Displaces Fe) Reaction (Displaces Cu) No Reaction
Iron (Fe) No Reaction No Reaction Reaction (Displaces Cu) No Reaction
Copper (Cu) No Reaction No Reaction No Reaction No Reaction

Precautions

  • Scrape off surface oxide layers on metal strips using sandpaper before dipping.
  • Do not disturb test tubes during the observation period.

Inference: A more reactive metal displaces a less reactive metal from its salt solution. The decreasing order of reactivity observed is:
Al > Zn > Fe > Cu

Viva-Voce Questions & Answers

Q1: Which metal among the tested ones is the most reactive?
Ans: Aluminum (Al).
Q2: What happens when a copper strip is placed in zinc sulphate solution?
Ans: No reaction occurs because copper is less reactive than zinc.
Q3: Why must metal strips be cleaned with sandpaper before the experiment?
Ans: To remove oxide coating layers that block direct contact between metal and solution.

Experiment 12 — Oxidation and Addition Reactions of Carbon Compounds

Aim: To carry out oxidation of ethanol using alkaline potassium permanganate and addition reaction of unsaturated hydrocarbons using bromine water/iodine.

Requirements: Ethanol (C2H5OH), alkaline KMnO4 solution, vegetable oil, butter/ghee, bromine water or iodine solution, test tubes, water bath, dropper, burner.

Procedure

  1. Oxidation: Take 2 mL of ethanol in a test tube. Heat it gently in a water bath. Add alkaline KMnO4 drop by drop while shaking. Note color disappearance.
  2. Addition: Take 2 mL of vegetable oil in test tube A and melted butter/ghee in test tube B. Add a few drops of bromine water or iodine solution to both and shake well.
Labelled Diagram: Draw two test tubes: one receiving drops of purple KMnO4 while sitting in a water bath, and two test tubes comparing bromine water decolorization in oil vs butter.

Observation Table

Test / Reactants Reagent Added Observation Type of Reaction
Ethanol + Heat Alkaline KMnO4 (dropwise) Pink color disappears initially, stays permanently when added in excess Oxidation Reaction
Vegetable Oil Bromine Water / Iodine Brown/Yellow color decolorizes Addition Reaction (Unsaturated)
Butter / Ghee Bromine Water / Iodine Brown/Yellow color remains unchanged No Addition Reaction (Saturated)

Precautions

  • Heat ethanol strictly using a warm water bath because ethanol is highly flammable.
  • Handle bromine water with care under guidance.

Inference: Ethanol undergoes oxidation to ethanoic acid using alkaline KMnO4. Unsaturated carbon compounds (oils) readily undergo addition reactions, whereas saturated compounds (ghee) do not.

Viva-Voce Questions & Answers

Q1: What role does alkaline KMnO4 play in the ethanol reaction?
Ans: It acts as an oxidizing agent, supplying oxygen to convert ethanol into ethanoic acid.
Q2: Why does vegetable oil decolorize bromine water while butter does not?
Ans: Vegetable oil contains unsaturated double bonds that add bromine across them, whereas butter contains saturated single bonds.
Q3: Write the chemical equation for the oxidation of ethanol.
Ans: CH3CH2OH  →[Alkaline KMnO4 + Heat]  CH3COOH

Video Walkthroughs of Navneet Science Journal Std 10

10th Science Practical Video Walkthroughs

1. Navneet Science Practical Experiments 1 to 6

Science Part 1 (Experiments 1 to 6): Covers step-by-step written answers for basic physics and chemistry reactions, including the reactivity series, refraction of light, and Ohm's Law setup.

2. Navneet Science Practical Experiments 7 to 12

Science Part 2 (Experiments 7 to 12): Details biology and environmental practicals such as binary fission in amoeba, budding in yeast, and plant tissue structure observation.

3. Class 10th Science Practical Book Full Walkthrough

Full Journal Overview: Provides a comprehensive line-by-line review of all journal pages so you can verify fill-in-the-blanks, multiple-choice questions, and labeled diagrams across all chapters.

4. Navneet Science 1st Practical Solutions

Experiment 1 In-Depth Guide: Explains the exact practical apparatus setup, observation reading calculations, and final result statements needed for Maharashtra Board internal evaluation.

Reminder: Check out the 10th Science Practical Book Solutions Walkthrough to quickly cross-check all your written responses and diagrams for Experiments 1 through 6 before submitting your journal.
Class 10 Science Practical FAQ

Frequently Asked Questions

Where can I get Class 10 SSC board science practical book solutions PDF?

You can find the standard answers and step-by-step experiment guides directly on our website for quick reference. While many students search for downloadable PDFs online, it is much safer to view updated solutions directly in your browser. This ensures you copy the correct observation tables, diagrams, and balanced chemical equations according to the latest Maharashtra State Board syllabus.

Note: Keep in mind that publishers like Navneet, Vikas, Balbharati, and Jeevandeep might arrange their practicals in a slightly different order. Always match the experiment title and objective—not just the experiment number—before writing it down in your journal.

How many experiments are there in Std 10 Science Journal (Part 1 & Part 2)?

The Maharashtra Board Std 10 Science curriculum is divided into two parts, each containing a set number of hands-on practicals:

  • Science & Technology Part 1 (Physics & Chemistry): Usually contains 10 main experiments covering key topics like chemical reactions, refraction of light, electric motors, and metallurgy.
  • Science & Technology Part 2 (Biology & Environmental Science): Typically includes 10 main experiments focusing on cell biology, genetics, microorganism classification, and ecosystem management.

Alongside these core experiments, your Navneet Science Journal also includes short practical activities and MCQs for each chapter. Completing all 20 practicals along with their respective observations ensures you score full marks in your internal school submission and practical board exams.

Link copied to clipboard!

Editorial Integrity

Our content is 100% human-written, evidence-backed, and continuously updated to fulfill reader intent with maximum honesty.

Daily Mindset Shift

"Small, consistent habits compounded over time create unshakeable momentum."

Leave a Comment